Introduction
Decentralized Finance (DeFi) offers various liquidity strategies through Automated Market Makers (AMMs). Traditional AMMs like Uniswap V2 use a constant product formula (x * y = k), spreading liquidity across all prices. This is simple but capital-inefficient for assets that trade in narrow ranges (e.g., stablecoins) because most liquidity is unused at extreme prices (How Concentrated Liquidity in Uniswap V3 Works – RareSkills). To improve efficiency, specialized models and new AMM designs have emerged. Curve Finance introduced the StableSwap model, which combines constant product and constant sum formulas to concentrate liquidity around a target price (usually 1:1 for stablecoins) (Overview – Curve Technical Docs). This design offers much lower slippage for swaps between like-valued assets compared to a pure constant product pool.
More recently, concentrated liquidity AMMs (CLAMMs) such as Uniswap v3 and Camelot allow liquidity providers (LPs) to allocate liquidity within specific price ranges rather than across the entire curve (Liquidity and Yield farming | Camelot DEX). Liquidity is divided into ticks (price intervals), and LPs choose which ticks to fund. Camelot, a CLAMM on Arbitrum, uses Uniswap v3’s model (via the Algebra engine) to let LPs concentrate capital where they expect the most trading, for example in a tight band around $1 for a stablecoin pair. This tick-based approach contrasts with Curve’s invariant formula – instead of the pool automatically shaping liquidity, LPs manually (or programmatically) shape the liquidity distribution.
Comparing Curve’s liquidity approach to CLAMM strategies is highly relevant for several audiences in DeFi:
- DeFi Investors (Traders and LPs): It helps them understand which platforms offer better trade execution and yield opportunities. For instance, traders want minimal slippage, and LPs want optimal fee earnings with minimal risk.
- AMM Platforms/Developers: The design trade-offs inform how new or existing DEXes might choose their AMM model. Curve’s success in stablecoin trading and Uniswap v3’s flexibility are case studies in liquidity design.
- Blockchain Teams/Projects: Projects launching tokens or stablecoins need to decide where and how to seed liquidity. Understanding whether a CLAMM (like Camelot) can mimic Curve’s deep liquidity can guide partnership and liquidity mining decisions.
In summary, this case study provides an overview of Curve’s StableSwap mechanism versus CLAMM (concentrated liquidity) strategies (with Camelot as an example). We will explore how each approach structures liquidity, analyze their efficiency and market impact, and discuss what the findings mean for stakeholders in the DeFi ecosystem.
Methodology
To compare the two liquidity strategies, we break down the core mechanics and then evaluate key factors (liquidity distribution, capital efficiency, and market-making implications):
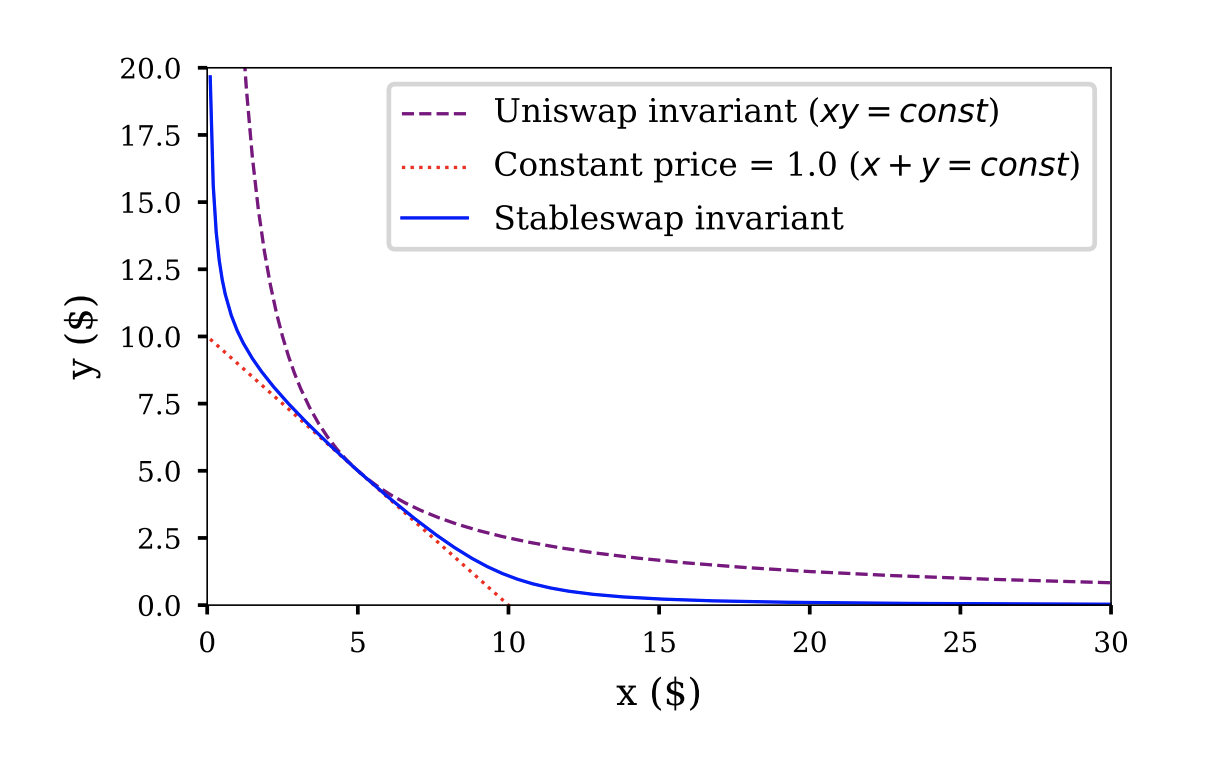
Curve’s Liquidity Structure: Curve’s StableSwap pools use a hybrid invariant that blends a constant sum component (x + y = C) with the classic constant product
component (x * y = k). In practice, this means the pool behaves nearly like a constant sum AMM when the asset ratios are close to balanced, giving extremely low slippage around the 1:1 price, and gradually transitions to a constant product-like behavior as the pool becomes imbalanced (Understanding StableSwap (Curve) »). An amplification factor (A) controls this interpolation. A high A heavily amplifies the constant sum portion, resulting in a very flat curve near the peg (lots of liquidity, low slippage), while still reverting to constant product if one asset is largely depleted to ensure the pool can’t be drained cheaply (Understanding StableSwap (Curve) »). We will interpret Curve’s liquidity curve shape as essentially providing deep liquidity in a narrow price band (for stablecoins, near $1) and shallower liquidity as the price moves further from the peg.
 CLAMM’s Tick-Based Liquidity: Concentrated liquidity AMMs like Uniswap v3/Camelot allow LPs to deposit liquidity only within chosen price ranges defined by ticks. For example, an LP might provide USDC-USDT liquidity only between $0.99 and $1.01. Within that range the liquidity is available for swaps; outside of it, the liquidity is inactive. Multiple LP positions at different ranges sum up to form the pool’s overall liquidity curve (Uniswap v3: The Universal AMM – Paradigm). We will examine how this piecewise liquidity distribution differs from Curve’s continuous formula. Notably, Camelot offers an Auto mode that actively manages LP ranges: it uses “focused liquidity management strategies” to adjust the position’s range as prices move (Liquidity and Yield farming | Camelot DEX). This means in Camelot (and similar CLAMMs) liquidity can be dynamically reallocated by algorithms or external strategies, whereas in Curve the liquidity distribution is fixed by the invariant formula and doesn’t require intervention.
Comparison Approach: We compare both strategies along three dimensions:
- Liquidity Distribution: We look at how liquidity is spread across prices. For Curve, this is derived from its invariant (with most liquidity centered at the equilibrium price). For CLAMMs, it depends on how many ticks and positions are used – e.g., one could simulate Curve’s distribution by placing liquidity in many small ranges. We will discuss the feasibility of matching Curve’s smooth curve with discrete tick-based positions.
- Capital Efficiency: We evaluate how efficiently each approach uses capital to achieve low slippage. This involves considering slippage for a given trade size and total liquidity. For example, Curve’s model might require a large total value locked (TVL) to cover all eventualities, while a concentrated approach could achieve the same slippage with less capital if it’s well-positioned. We will use known metrics like slippage on large trades and volume-to-liquidity ratios to assess efficiency.
- Market-Making Impact: We examine what each approach means for LPs and market-making. Curve’s pools are largely passive (LPs deposit and the formula handles pricing continuously), minimizing maintenance. CLAMMs, on the other hand, give LPs more control but also more responsibility – positions must be adjusted or else risk being out of range (earning no fees when out of range). We consider the operational complexity (e.g., the need for tools like Steer or Camelot’s auto-manager) and risk profiles (impermanent loss behavior, etc.) under each model.
Our analysis uses a combination of theoretical understanding and historical data. We reference external research on slippage and volume metrics (especially how Uniswap v3’s introduction affected Curve) to ground the comparison in real market outcomes. By comparing both the design intent and actual performance, we aim to highlight the practical pros and cons of Curve’s invariant versus CLAMM strategies.
Results & Analysis
Liquidity Efficiency – Curve vs. Concentrated: Curve’s design is very efficient for its intended use (swapping similarly priced assets). Around the peg price, Curve offers massive liquidity depth. This translates to minimal slippage for trades, even large ones, as long as the assets’ values remain near parity. For instance, a single Curve stablecoin pool can handle an extraordinarily large swap with modest slippage: a $100 million USDT-to-USDC trade through Curve’s 3Pool incurred only about $100k of slippage, whereas the same trade on Uniswap required routing through seven different pools and would lose over $11 million to slippage (Whales vs. Retail: Who’s Using Curve? | by Riyad Carey | Kaiko). This highlights Curve’s one-stop liquidity depth – all capital in the pool collectively provides depth at the crucial 1:1 price, which is hard to beat when moving huge sums.
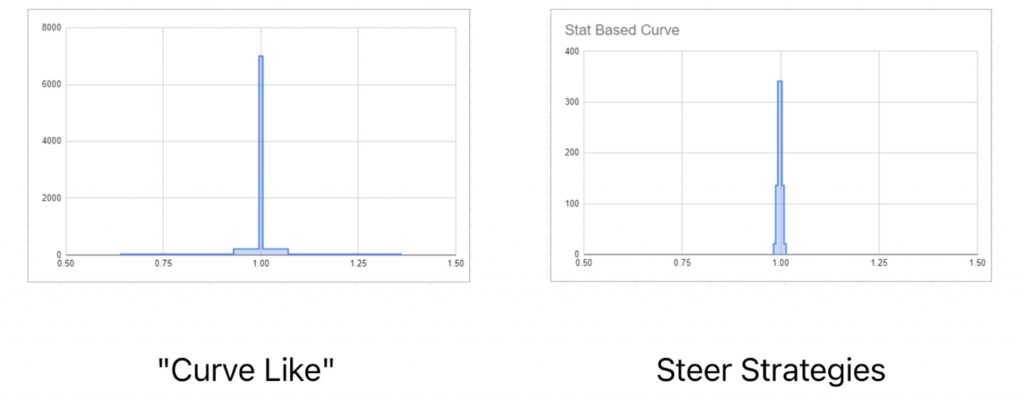
Uniswap v3 (and Camelot by extension) can match or even exceed that efficiency if liquidity is properly concentrated. In theory, Uniswap v3 is a “universal” AMM that can replicate any static curve by combining enough positions (Uniswap v3: The Universal AMM – Paradigm). In practice, this means a CLAMM can approximate Curve’s low-slippage curve by splitting liquidity into multiple narrow ranges around $1. Tools like Steer Protocol have demonstrated this by implementing “curved liquidity” strategies on CLAMMs – effectively mimicking Curve’s distribution within Uniswap v3-style pools (Liquidity Kit | Steer Protocol). Steer provides a library of liquidity curve shapes and can deploy capital across ticks accordingly, allowing a concentrated pool to closely resemble Curve’s invariant (Liquidity Kit | Steer Protocol). With such strategies, a Camelot pool could concentrate, say, 80% of liquidity in the $0.99–$1.01 range and 20% in wider outer ranges for safety. This would yield similar low slippage near $1 as Curve does, enabling CLAMMs to compete head-on in efficiency.
However, there are practical limits and considerations:
- Number of Positions (Granularity): In a CLAMM, approximating a smooth curve requires dividing liquidity into discrete chunks. Even a two-position setup can make a big difference (e.g. one concentrated range for most liquidity and one covering a broad range for resilience). For example, one could allocate a high-liquidity position from $0.99–$1.01 (to greatly reduce price impact in that band) and a low-liquidity position covering the rest of the range for coverage (How Concentrated Liquidity in Uniswap V3 Works – RareSkills). This piecewise approach significantly lowers slippage around $1 with far less capital than a uniform pool. Increasing the number of positions (3, 5, 10, etc.) can refine the approximation of Curve’s curve – the more segments, the closer to a truly smooth distribution. Optimal positions: There isn’t a one-size-fits-all number; it’s a trade-off between precision and complexity. In practice, a handful of well-chosen ranges can achieve most of the benefits. Each additional position yields diminishing returns in slippage improvement but adds gas costs and management overhead. Strategies like Steer optimize this by algorithmically determining how to split liquidity (they can use as many ticks as needed, but aim for efficiency). The key takeaway is that it is feasible to match Curve’s liquidity profile on a CLAMM, but it may require multiple managed positions, whereas Curve attains its profile natively via the invariant.
- Advantages & Limitations: Curve’s model guarantees a continuous liquidity curve without active management. LPs face low impermanent loss for stable pairs and don’t worry about ranges at all – they just deposit equal value of assets and the pool always provides liquidity (price will move but the pool remains active at all prices). This hands-off stability is an advantage: even during volatility or a depeg scare, Curve’s pool still functions (slippage increases as the pool unbalances, but it doesn’t “run dry” until one asset is essentially gone). On the flip side, Curve is less flexible – the formula is fixed for a given pool. If market conditions change (say, volatility increases or a new equilibrium price emerges), Curve cannot adjust its parameters without a new pool deployment. CLAMMs like Camelot/Uniswap v3 offer extreme flexibility: liquidity can be reallocated on the fly to where it’s needed most, and even different fee tiers can exist for different use cases. They achieve higher capital efficiency per dollar when done right, because no liquidity is wasted on price regions that aren’t used (unlike a Curve pool which still spreads some liquidity toward the extremes). The limitation, however, is that this requires active management. Without automated strategies, an LP’s concentrated position can end up out of range (earning nothing until rebalanced). Even with automation, there are costs and risks: frequent rebalancing can incur gas and operational risk, and if the strategy is poorly managed, the pool might momentarily have gaps in liquidity. In summary, Curve’s approach is passive but robust, while CLAMM’s approach is agile but demands effort.
- Liquidity Distribution & Market Share: Historically, Curve’s stablecoin pools attracted enormous liquidity and became the go-to venues for large stablecoin trades. Prior to 2021, Curve routinely handled the vast majority of all stablecoin DEX volume (often >90% of DAI/USDC/USDT swap volume) as it had little competition in slippage for those trades (The StableSwap Wars – Curve vs. Uniswap) (Uniswap vs Curve: Which Is the Best DEX? – Delphi Digital). The launch of Uniswap v3 in May 2021 altered the landscape. By allowing anyone to concentrate liquidity at 1:1, Uniswap v3 started capturing significant stablecoin volume from Curve (Uniswap vs Curve: Which Is the Best DEX? – Delphi Digital). Liquidity providers moved some capital to Uniswap v3 stablecoin pools (especially once Uniswap introduced a very low 0.01% fee tier for stable pairs), and traders followed the liquidity. Over time, Uniswap v3 often rivaled or even surpassed Curve in daily stablecoin trading volume. For example, over a recent one-year period Uniswap v3 facilitated about $38.7 billion in USDT-USDC trading vs. $27.9 billion on Curve’s pool (Whales vs. Retail: Who’s Using Curve? | by Riyad Carey | Kaiko). This indicates Uniswap v3’s concentrated model can aggregate enough liquidity to beat Curve on total volume. However, Curve retained an edge in handling the largest trades. Data shows that for huge swaps (>$10M), Curve had more volume and better execution; e.g. for 10–15 million dollar trades in USDT-USDC, Curve handled roughly double the volume of Uniswap v3, and Uniswap v3 had no trades above $40M in that period (Whales vs. Retail: Who’s Using Curve? | by Riyad Carey | Kaiko). This is consistent with the earlier example – whales and institutions trust Curve’s deep, single-pool liquidity for moving size. Meanwhile, Uniswap v3 excels at many smaller to mid-sized trades aggregated across many users. As a result, Curve’s share of the stablecoin swap market has fluctuated. On average, Curve has held on the order of ~10–20% of combined Curve+Uniswap stablecoin volume in recent years, but with notable spikes during periods of market stress (e.g. spiking to ~36% share during the Terra stablecoin crisis) and lows when stablecoin trading is calm (dropping to ~2–3% in quiet weeks) (Whales vs. Retail: Who’s Using Curve? | by Riyad Carey | Kaiko). These trends illustrate that CLAMM-based DEXs can compete strongly with Curve, especially in normal market conditions, but Curve’s model still shines for certain niches like mega-trades and panic scenarios.
Steer Strategies and Camelot’s Competitiveness: A major development enabling CLAMMs to fully compete with Curve is the rise of automated liquidity management strategies. Steer’s strategies essentially give CLAMMs a brain – they adjust positions algorithmically to maintain an optimal liquidity curve. Steer was the first to implement curved range positioning on Uniswap v3-style pools (Liquidity Kit | Steer Protocol), demonstrating that a well-run strategy can make a concentrated pool mimic any target curve. In Camelot’s case, its built-in Auto mode is a user-friendly way to leverage such active management (Liquidity and Yield farming | Camelot DEX). These strategies can continuously “steer” liquidity to follow the price (for volatile pairs) or to remain centered if the peg shifts slightly for stablecoins. The result is that Camelot and similar CLAMMs can offer virtually the same experience to traders as Curve (tight spreads, low slippage), given sufficient liquidity and a good strategy. The playing field is further leveled by incentive programs: for example, if Camelot offers yield farming rewards for its stablecoin LPs, it can attract large TVL and then deploy it efficiently via Auto mode or Steer, effectively reproducing Curve’s depth. The main hurdle is coordination and complexity – it’s easier for an LP to just use Curve and not worry about anything, whereas on a CLAMM the LP either has to actively manage or entrust their funds to a strategy contract. Nonetheless, the evidence suggests that technically there’s no insurmountable barrier preventing CLAMMs from matching Curve’s liquidity profile; it’s more a question of execution and adoption.
Conclusion & Implications
Summary of Findings: Curve’s liquidity approach and CLAMM strategies each have distinct strengths. Curve uses a formula-driven invariant that passively provides deep liquidity for like-valued assets, yielding ultra-low slippage near the target price (Understanding StableSwap (Curve) »). CLAMMs (exemplified by Camelot’s Uniswap v3-based model) allow liquidity to be highly concentrated via ticks, achieving greater capital efficiency but requiring active management (Liquidity and Yield farming | Camelot DEX). Our analysis shows that with modern automated strategies (e.g. Steer), concentrated liquidity pools can replicate Curve’s liquidity curve quite closely, thereby offering comparable trading efficiency. The optimal approach can depend on the context: for purely passive liquidity in a stablecoin pair, Curve’s invariant is extremely effective; for more dynamic scenarios or multi-purpose pools, CLAMMs offer flexibility. Uniswap v3’s debut clearly eroded Curve’s monopoly on stablecoin swaps by enabling similar performance (Uniswap vs Curve: Which Is the Best DEX? – Delphi Digital), but Curve still holds a critical role for handling the largest trades and during turbulent markets (Whales vs. Retail: Who’s Using Curve? | by Riyad Carey | Kaiko) (Whales vs. Retail: Who’s Using Curve? | by Riyad Carey | Kaiko).
Key Takeaways for Stakeholders:
- DeFi Investors (LPs and Traders): If you’re providing liquidity in stablecoin markets, Curve gives a set-and-forget solution with reliable yields from large stable volume. Concentrated liquidity (Camelot/Uniswap v3) can yield higher fee returns on capital (due to focusing liquidity where trades happen), but it benefits greatly from active management – consider using automated vaults or strategies to manage ranges. For trading, both Curve and well-managed CLAMM pools can offer excellent rates on stable swaps; Curve might have the edge for huge orders, while CLAMMs often have competitive or better rates for typical trade sizes when liquidity is concentrated. It’s wise to monitor where liquidity is moving (e.g., if a lot of liquidity shifts to Camelot’s pool due to incentives, that pool may become the best venue).
- AMM Developers/Platforms: The comparison suggests there’s merit in hybrid approaches. Curve’s success underscores demand for low-slippage stable swaps, while Uniswap v3’s success shows the power of flexible liquidity. New AMM designs might consider combining the two – for instance, automated concentration that behaves like Curve when assets are at parity, but gives flexibility to adjust parameters. Even Curve V2 (for volatile assets) and upcoming Uniswap V4 features indicate convergence: Curve is adding more dynamic pricing for non-pegged assets, and Uniswap V4 will introduce hooks that could allow implementing custom curve logic in a Uniswap-like environment. Platforms like Camelot already integrate auto-management to lower the barrier for LPs (Liquidity and Yield farming | Camelot DEX). Going forward, AMMs that treat liquidity as an actively managed utility may achieve the best of both worlds.
- Blockchain Teams/Projects: Teams launching stablecoins or running a DeFi project should note that liquidity provisioning has evolved. One cannot assume “build it and they will come” for liquidity – active strategy and incentives are key. If deciding between Curve or a CLAMM for your token’s liquidity, consider the trade-offs. Curve pools can be great if your token has a stable reference price (or is a stablecoin) and you want deep liquidity with low maintenance (and if you can attract Curve LPs via incentives like Curve gauges). On the other hand, using a CLAMM (like providing initial liquidity on Uniswap v3 or Camelot) with a managed strategy can be more capital-efficient, meaning you might achieve tight spreads with less total capital – but you’ll need to either manage it or partner with a service (like Steer or an LP manager) to do so. Being aware of these nuances helps in planning liquidity mining campaigns and choosing exchange venues.
Can Camelot and other CLAMMs compete with Curve using Steer strategies? Based on the evidence, yes. With a competent strategy that mimics Curve’s curve, a CLAMM pool can provide equally low slippage. Camelot already offers automated liquidity management, and third-party strategies like Steer’s “curved liquidity” can be applied to concentrate liquidity just as Curve would distribute it (Liquidity Kit | Steer Protocol). The competition then is less about technology and more about liquidity aggregation and user trust. Curve has brand loyalty and a moat in the form of its DAO incentives (CRV rewards) which attract large LPs. CLAMMs can compete by offering attractive yields and ease-of-use (auto management) to draw LPs away. If Camelot, for example, can demonstrate that its USDC/USDT pool consistently matches Curve’s 3Pool in slippage and offers better rewards, it will attract volume and liquidity accordingly. We are essentially seeing a convergence where active liquidity provision can emulate passive invariants, so the playing field is level; whoever brings more liquidity and better execution will win out.
Future Trends: The landscape of AMMs is continuing to innovate. Uniswap v3 proved that customizable liquidity is powerful, and now the focus is on making it easier and smarter to use. We can expect to see more automated or smart liquidity provisioning across platforms. Uniswap v4’s proposed hooks (allowing custom code to execute at certain pool events) could enable on-chain strategies that adjust liquidity or even implement hybrid curves. Projects like Steer indicate a trend toward treating liquidity as programmable infrastructure rather than a static pool (Liquidity Kit | Steer Protocol). We might see cross-platform liquidity management where a protocol directs liquidity to where it’s needed most across different AMMs. Curve, for its part, is not standing still either – Curve’s upcoming innovations (like crvUSD with an automated peg-keeper and potential new AMM formulations) could further enhance how liquidity is utilized in stablecoin markets.
In conclusion, Curve’s invariant and CLAMM strategies each offer valuable lessons. Curve shows the power of a well-designed formula to simplify user experience and enable huge trades, while Camelot/Uniswap v3 show that flexibility can unlock efficiency gains. For DeFi investors and builders, the key insight is that liquidity provision can be as adaptive or as hands-off as needed. With the advent of automated strategies, the gap between passive and active approaches is closing. We expect future AMMs to increasingly blend these approaches – providing users the low slippage and reliability of something like Curve, with the agility and efficiency of concentrated liquidity. This synergy will shape the next generation of liquidity protocols in DeFi, ultimately benefiting traders (through better prices) and liquidity providers (through better capital usage) alike.
References:
- Curve’s StableSwap invariant combines constant sum and constant product formulas (Understanding StableSwap (Curve) ») (Overview – Curve Technical Docs).
- Camelot (Uniswap v3-style) concentrated liquidity allows LPs to focus on specific price ranges (Liquidity and Yield farming | Camelot DEX). Camelot’s Auto mode automates range adjustments (Liquidity and Yield farming | Camelot DEX).
- Steer Protocol has pioneered curved liquidity management on CLAMMs, enabling any desired liquidity distribution via multiple positions (Liquidity Kit | Steer Protocol) (Liquidity Kit | Steer Protocol).
- Example of concentrated liquidity strategy: a high-liquidity band around $1 (0.99–1.01) dramatically reduces slippage for stablecoin trades (How Concentrated Liquidity in Uniswap V3 Works – RareSkills).
- Uniswap v3 can theoretically emulate any AMM curve by using multiple tick ranges (it’s a “universal AMM”) (Uniswap v3: The Universal AMM – Paradigm).
- Uniswap v3’s launch allowed it to capture significant stablecoin volume from Curve (Uniswap vs Curve: Which Is the Best DEX? – Delphi Digital). As a result, Uniswap v3 handled $38.7B of USDT-USDC volume vs. $27.9B on Curve over one period (Whales vs. Retail: Who’s Using Curve? | by Riyad Carey | Kaiko), though Curve led for the largest trades (>$10M) (Whales vs. Retail: Who’s Using Curve? | by Riyad Carey | Kaiko).
- A $100M USDT-USDC swap saw only $100K slippage on Curve (3Pool), vs $11M+ slippage on Uniswap through multiple pools (Whales vs. Retail: Who’s Using Curve? | by Riyad Carey | Kaiko) – highlighting Curve’s deep liquidity for huge orders.
- Curve’s market share in stablecoin trading was ~15% versus Uniswap, spiking to ~30–38% in crises and dipping to ~2–3% at lows (Whales vs. Retail: Who’s Using Curve? | by Riyad Carey | Kaiko), showing its niche strength despite Uniswap v3’s dominance.
- Future liquidity strategy trends point to improved AMM designs and automation (e.g., Uniswap v4 hooks) that make liquidity a flexible, shared utility across platforms (Liquidity Kit | Steer Protocol).